
Effects on Efficiency—Takt Time
Oct 3, 2024
 Whenever I visit a factory where manual work is done, I try to estimate the percentage of value-adding time. This brings up an interesting question: What factors do affect the percentage of value-adding time? Let’s dig through my data to see what matters.
The Question
Whenever I visit a factory where manual work is done, I estimate the percentage of value-adding time. This can be done simply by counting whenever you see an operator adding value…or not. Note that waste is usually not the fault of the operator, but of the system. If the operator has to walk five meters to get a part, it is not his fault that the part is so far away. For more on the method, see my blog post How to Estimate Value Add for Manual Work – How to See Waste!.

Obviously, the higher the percentage of value-adding time, the lower the labor cost for assembly and other manual operations. Hence, I want to see what factors do make a difference for the percentage of value-adding time.

One major influence is the takt time (i.e., the average time between the completion of a part). My assumption is that a faster takt (i.e., a faster speed) makes more efficient lines.
Another influence is the group size. Is it beneficial to give the operator more support by having more supervisors? Here, smaller groups are beneficial.
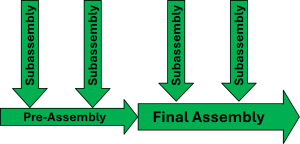 Another possible influence is whether the line is a final assembly or a subassembly. In many plants the focus of management is heavily on the final assembly, sometimes even neglecting the subassemblies or pre-assemblies. Hence, my assumption is that the final assembly is often the best-managed line in the house.
I also want to look at the product type. Since I’m focusing on automotive, most of my data is related to that. But does it make a difference whether the vehicle is a passenger vehicle or commercial vehicle?
 Finally, and just because I have the data, does it make a difference whether the line is in Japan or in Germany? Since I know my data, I expect Japan to be better. Of course, physics works the same anywhere in the world, and the technical aspect of assembling a product is the same. However, Japanese shop floor managers often pay much more attention to detail, and also have much more manpower available to help and support the operator, improve the system, and run the line generally better.
The Dataset
I have a good-sized database of my observations of manual work that I’ve observed all over the world within the last ten years. In many of these plants I also observed multiple lines or across multiple visits. Below is an excerpt of some plants. At a first glance, it seems that Toyota and Nissan are doing quite well, and that Japan on average is better than Germany, albeit BMW is also doing pretty good.
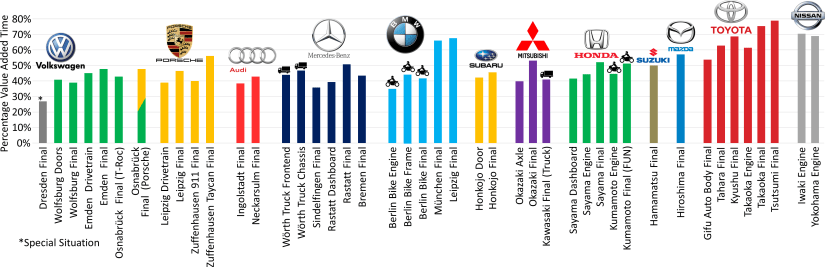
After correcting for missing or incomplete data, I have fifty-three observations in thirty-two different plants. Thirty-four of these observations were in Germany and nineteen in Japan. Forty-seven were final assembly lines, and six were subassemblies or pre-assemblies. I measured the efficiency of a lot more subassemblies, but often I didn’t know the corresponding takt time. As for the products, forty-three were assembly lines directly or indirectly related to passenger vehicles, and nine were for commercial vehicles. One observation was for commercial furniture.
Takt Time
The first plot shows the takt time versus the estimated percentage value added time for all fifty-three observations. The shortest observed takt time was 40 seconds, and the longest one 30 minutes (1800 seconds). The operators in the worst plant added value only 26% of the time, whereas the best plants achieved 79% value-adding time.
The graph below shows the plot of the percentage value-adding time over the takt time. Since there are a lot of short takt times and only a few longer ones, I also added a graph with the takt time on a logarithmic scale next to it. Both graphs also have a power trendline to aid the visualization.

It seems you can have an inefficient line at any speed, as the worst fast lines are just as bad as the worst slow lines. However, the best lines all have a fast takt time. In this example, any line with a percentage value-adding time of 65% or higher had a takt time between 50 and 75 seconds. There is also no value-added time above 60% for takt times slower than 200 seconds. It seems that a fast line enables you to achieve high value adding percentages—albeit that is by no means granted, as some lines with similar takts performed worse. Slow takt times seriously handicap efficiency.
This does make sense to me. A high percentage value-adding time is all about efficiency, optimizing your processes. Go through every step of the cycle and determine whether you could reduce waste and reduce fluctuations. Can you put the tool and materials closer? Can you improve the tool or the workplace? Can ergonomics be improved?
This is all doable, but it takes time and effort (and sometimes a bit of money too). The benefit is less labor cost to make the product. A 60-second cycle is much easier to improve than a 30-minute cycle. For 60 seconds, you can easily have a work standard showing you the right-hand and left-hand actions in great detail. For 30 minutes the work standard is usually much less detailed.
While it is technically the same if you improve thirty different stations with 60-second takt or one station with a 30-minute takt, the quantity produced is quite different. With a takt time of 60 seconds you get 420 parts per shift. With a takt of 30 minutes, only 14 parts per shift are produced. Hence, the output is 30 times less, and you get 30 times less benefit for the same improvement effort.
Additionally, it’s just easier to manage a 60-second cycle than a 30-minute cycle. It takes 10 minutes to observe ten 60-second cycles, and you have a good grasp of what is going on during the 60 seconds. If you make 10 observations in a 30-minute cycle, 5 hours have passed and the day is over. Plus, you probably don’t even remember what happened in the first hour. I personally can focus on observing a station for 1 to 2 hours, but after that I’m mentally drained and need a break. Even if it’s the same overall work content, shorter takt times create nice bite-sized chunks for improvement, whereas improving a long takt time is quite daunting.
This applies not only for improving the work, but also for learning the work in the first place. Repetition helps the operator to learn the tasks and develop skills from beginner to intermediate to expert. A short takt time makes it much easier for the operator to excel in his work. It’s so much easier to master 60 seconds of work than 30 minutes. This is one of the reasons why experts recommend work content between 30 and 90 seconds for manual work.
Overall, this can easily double the percentage of value-added time. In my data, the slow lines have a trendline of 30% value-added time, whereas the fastest lines have a trendline of 60% value-added time. Or, in easier words: You need half the people for a fast line compared to a slow line for the same work. Half the labor cost! Albeit there are some other factors like how it is trickier to set up a good fast line than to merely let the operators muddle through with a slow line. But half the labor cost. Wow!
Hence, the big learning from the first part of the analysis is: Keep your takt times short for efficient production! In my next post I will look at some other factors, like the group size, comparing Japan and Germany, final assemblies with subassemblies, and passenger cars with commercial vehicles. Keep on reading. Now, go out, set up fast lines, and organize your industry!
Stay In Touch.
Subscribe to our newsletter and exclusive Leadership content.